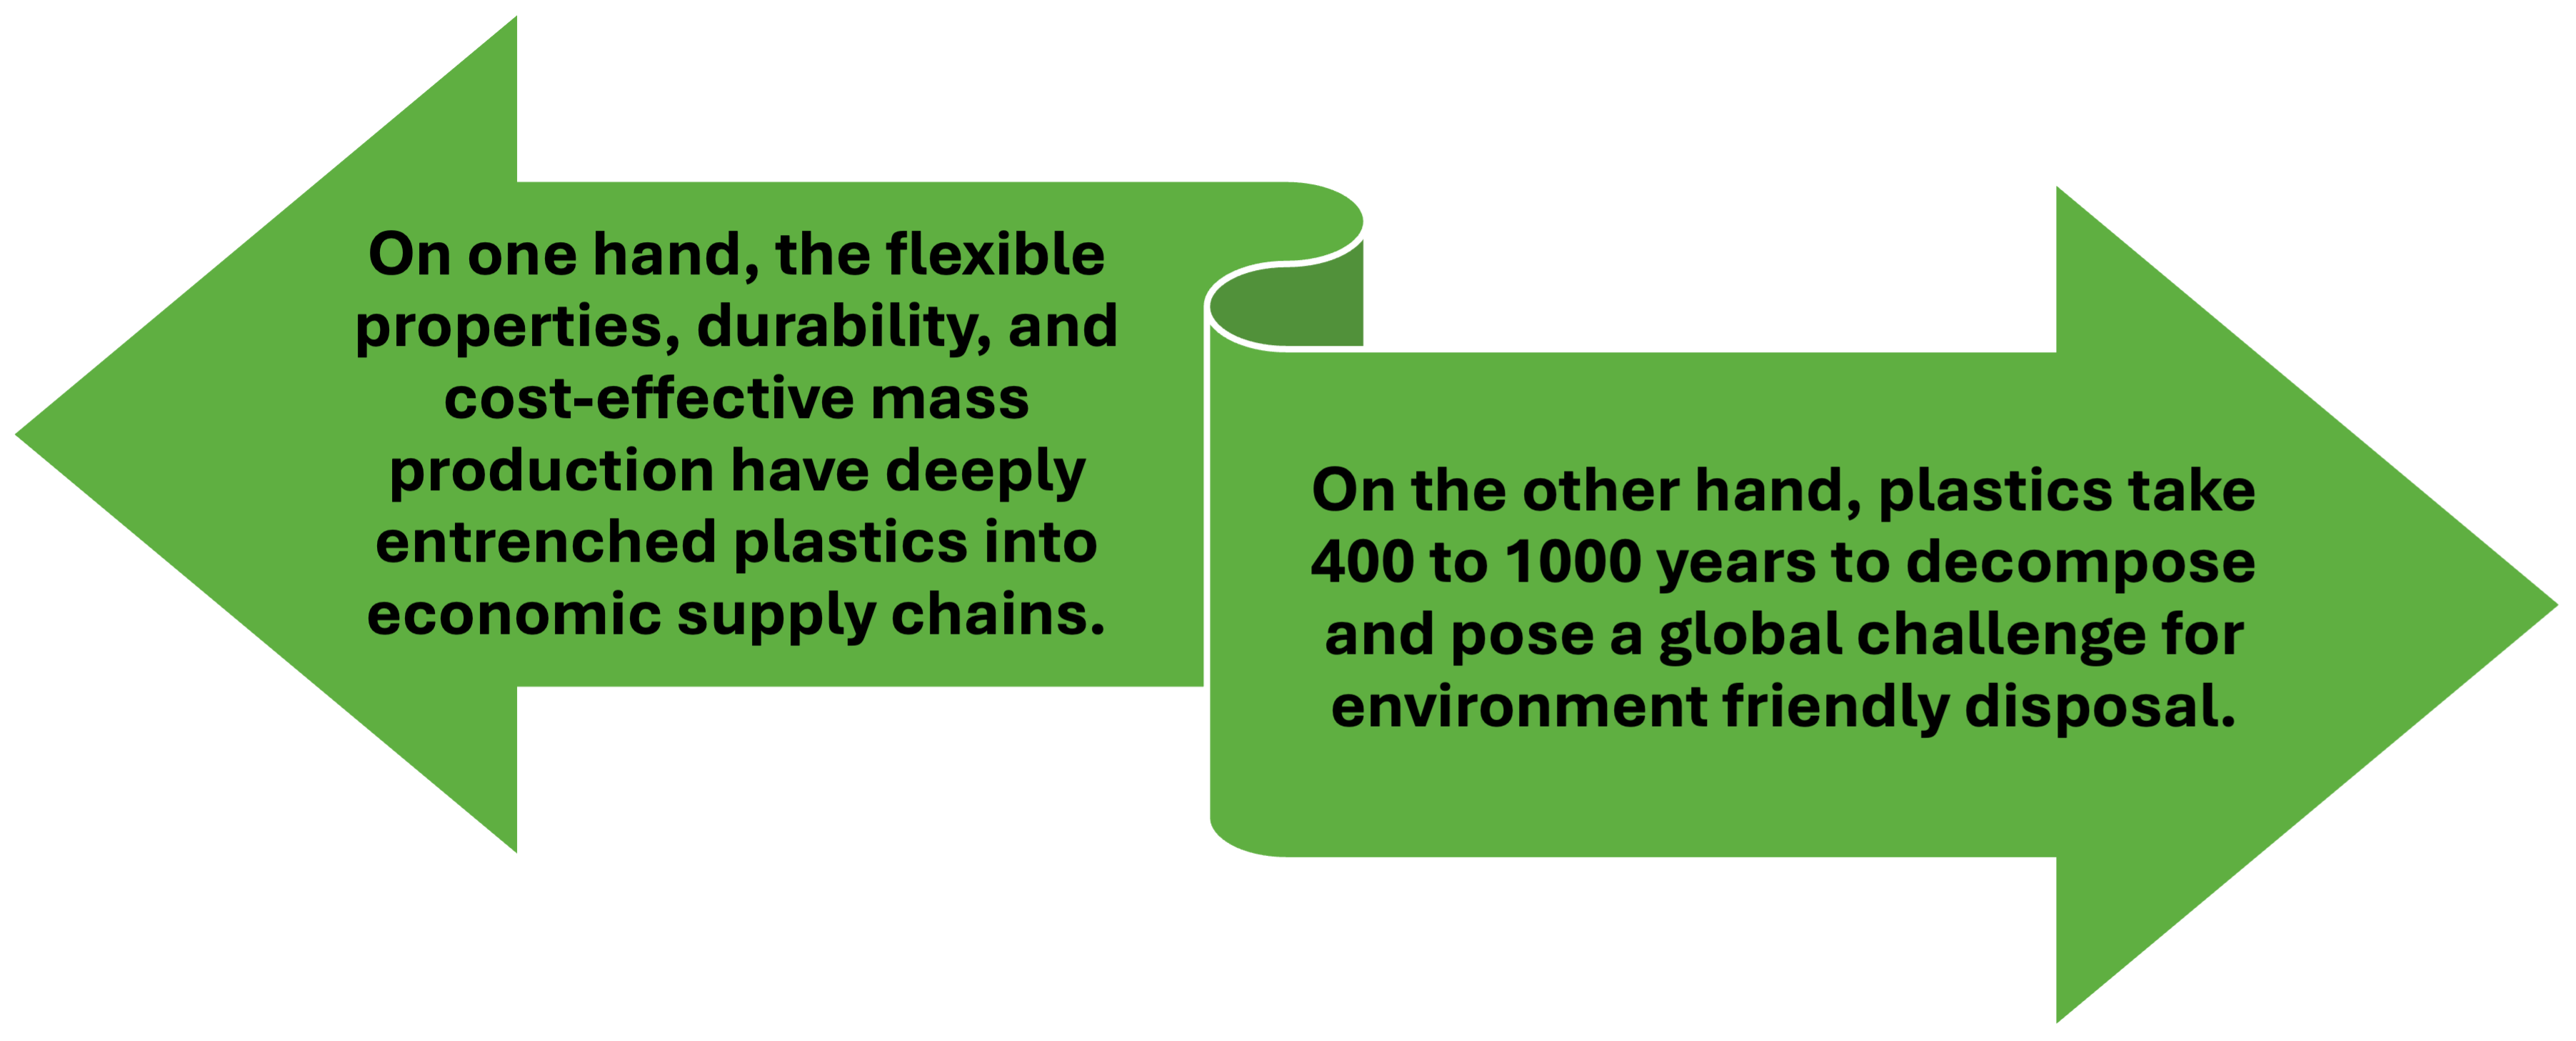
The Plastic Paradox: Our Convenience, Earth’s Challenge
The Scale of the Challenge
- Globally, plastic waste has grown into one of the most pressing environmental issues of our time
- ~400 million metric tonnes of plastics are produced annually worldwide
- ~353 million metric tonnes are discarded as waste each year
- Only ~9% of plastic waste is recycled
- The remainder is landfilled, incinerated, or mismanaged, leading to pollution and high greenhouse gas emissions
Global Plastic Waste by Disposal Method
Landfilled174 Million MT
Mismanaged79 Million MT
Incinerated65 Million MT
Recycled31 Million MT
Why Current Recycling Falls Short
- Conventional mechanical recycling technologies are limited in scope and are primarily suited for rigid, single-polymer plastics such as PET and HDPE
- These systems require clean, segregated waste streams, which are rarely available at scale
- Inability to process mixed and contaminated plastics
- Exclusion of soft plastics and multilayer packaging
- Quality degradation of recycled resin, leading to down-cycling instead of true material recovery
- As a result, flexible and mixed plastic waste remains largely unrecyclable through traditional methods
Composition of Waste
- PET
- HDPE
- PVC
- LDPE
- PP
- PS
- Others
Composition of 9% Recycled
- PET
- HDPE
- LDPE
- PP
- Others
Global & Indian Plastic Waste – Key Data Snapshot
| Indicator | Global Scenario | India Scenario |
|---|---|---|
| PRODUCTION & WASTE GENERATION | ||
| Annual Plastic Production | ~400 million tonnes / year | ~26 million tonnes / year |
| Annual Plastic Waste Generated | ~350 million tonnes | ~9.4 million tonnes |
| Per Capita Plastic Waste | ~45 kg / person / year | ~7 kg / person / year |
| WASTE MANAGEMENT | ||
| Recycling Rate | ~9% | ~30% (formal + informal) |
| Landfilled / Dumped | ~40% | ~60% inadequately managed |
| Incinerated / Energy Recovery | ~20–22% | <5% |
| Mismanaged Plastic Waste | ~22% | ~3.5 million tonnes / year |
| ENVIRONMENTAL IMPACT | ||
| Plastic Entering Oceans | ~11 million tonnes / year | Major riverine contributor |
| Major Use Segment | Packaging (~40%) | Packaging (~43%) |
| Projected Growth (No Action) | Nearly triple by 2060 | Double by 2035 |
| Environmental Impact | 85% of marine litter | Flooding, soil & river pollution |
Solutions Being Explored for Mixed Plastic Waste
Incineration / Waste-to-Energy
- Incineration recovers energy by burning plastic waste to generate heat or electricity
- Produces air pollutants and toxic ash
- Generates high greenhouse gas emissions
- Does not enable material recovery or circularity
Gasification / Waste-to-Energy
- Converts plastic waste into syngas under controlled conditions
- Requires complex systems and advanced process controls
- Is capital-intensive
- Faces operational and scale-up challenges
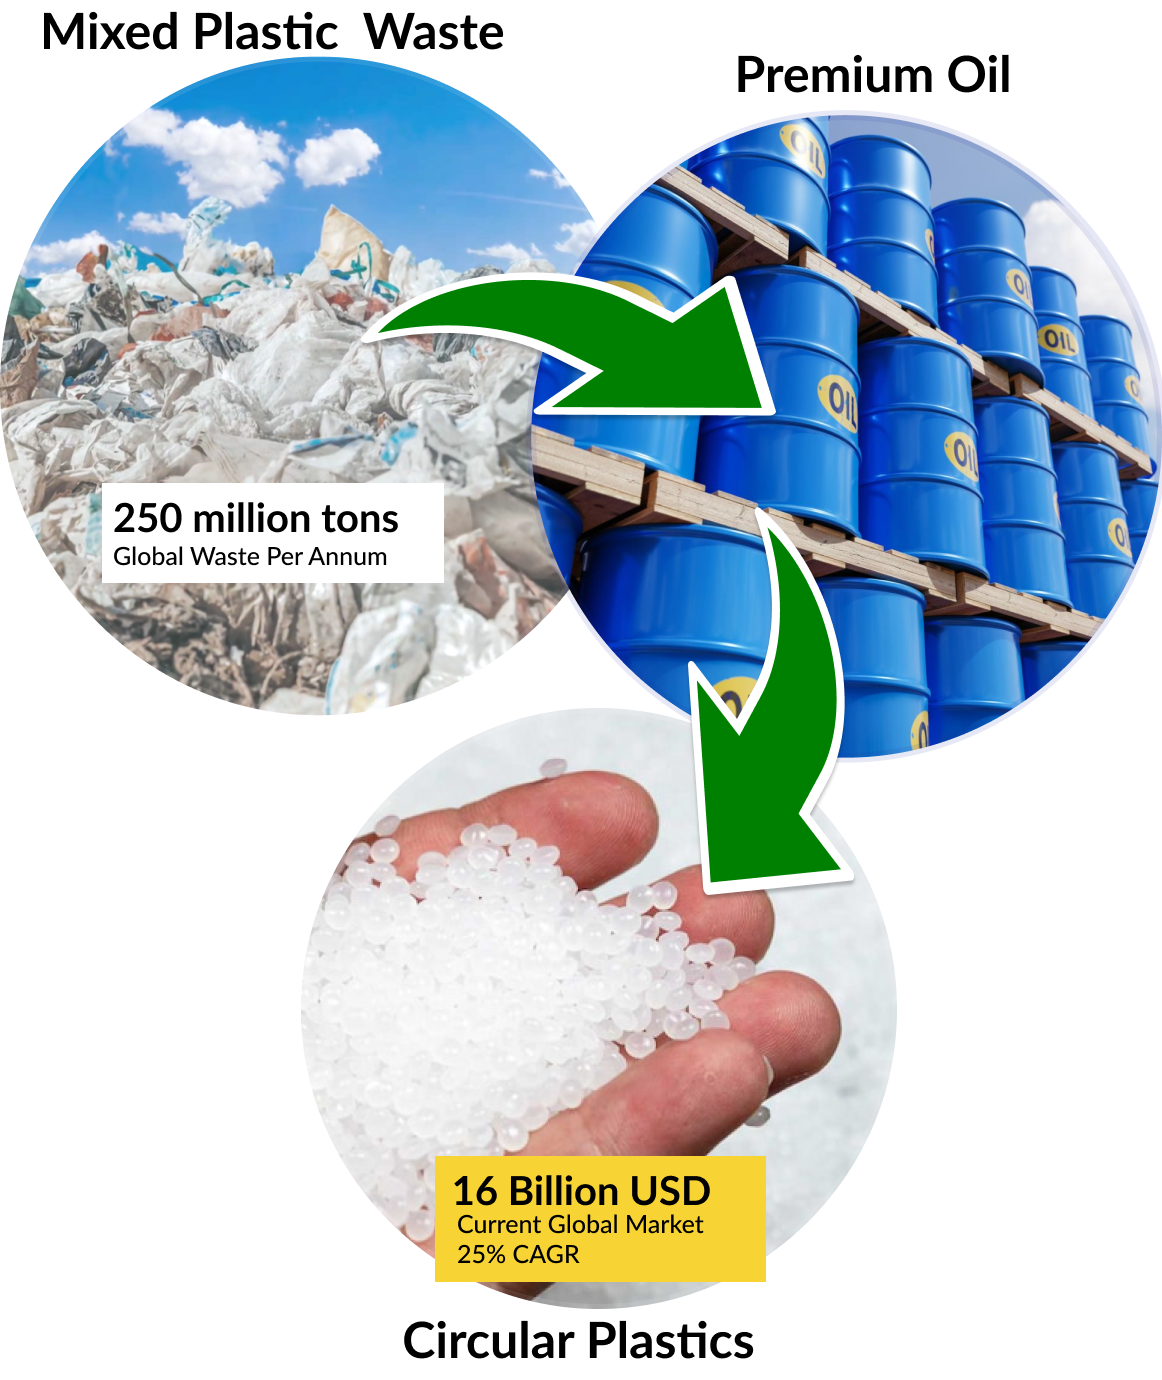
Plastic-to-Oil / Advanced Chemical Recycling
- Capable of processing mixed and contaminated plastics
- Higher material recovery compared to incineration
- Lower emissions profile
- Strong alignment with circular economy principles
- Enables plastics to return to the value chain as refinery-grade circular feedstock
Emerging Market for Circular Polymers
Global policy, industry commitments, and consumer demand are accelerating the shift toward circular materials.
Key regulatory and market drivers:
- Europe: 55% plastic packaging recycling mandate by 2030
- USA & Canada: Recycling targets rising from ~5% to 50% by 2030
- India: Plastic Waste Management Rules (2016) and Extended Producer Responsibility (EPR)
- Middle East: UAE National Plastic Recycling Initiative and Saudi Vision 2030
- Advanced chemical recycling is increasingly recognized as a critical enabler of these goals